
What Is a Good Engagement Rate? 2026 Benchmarks
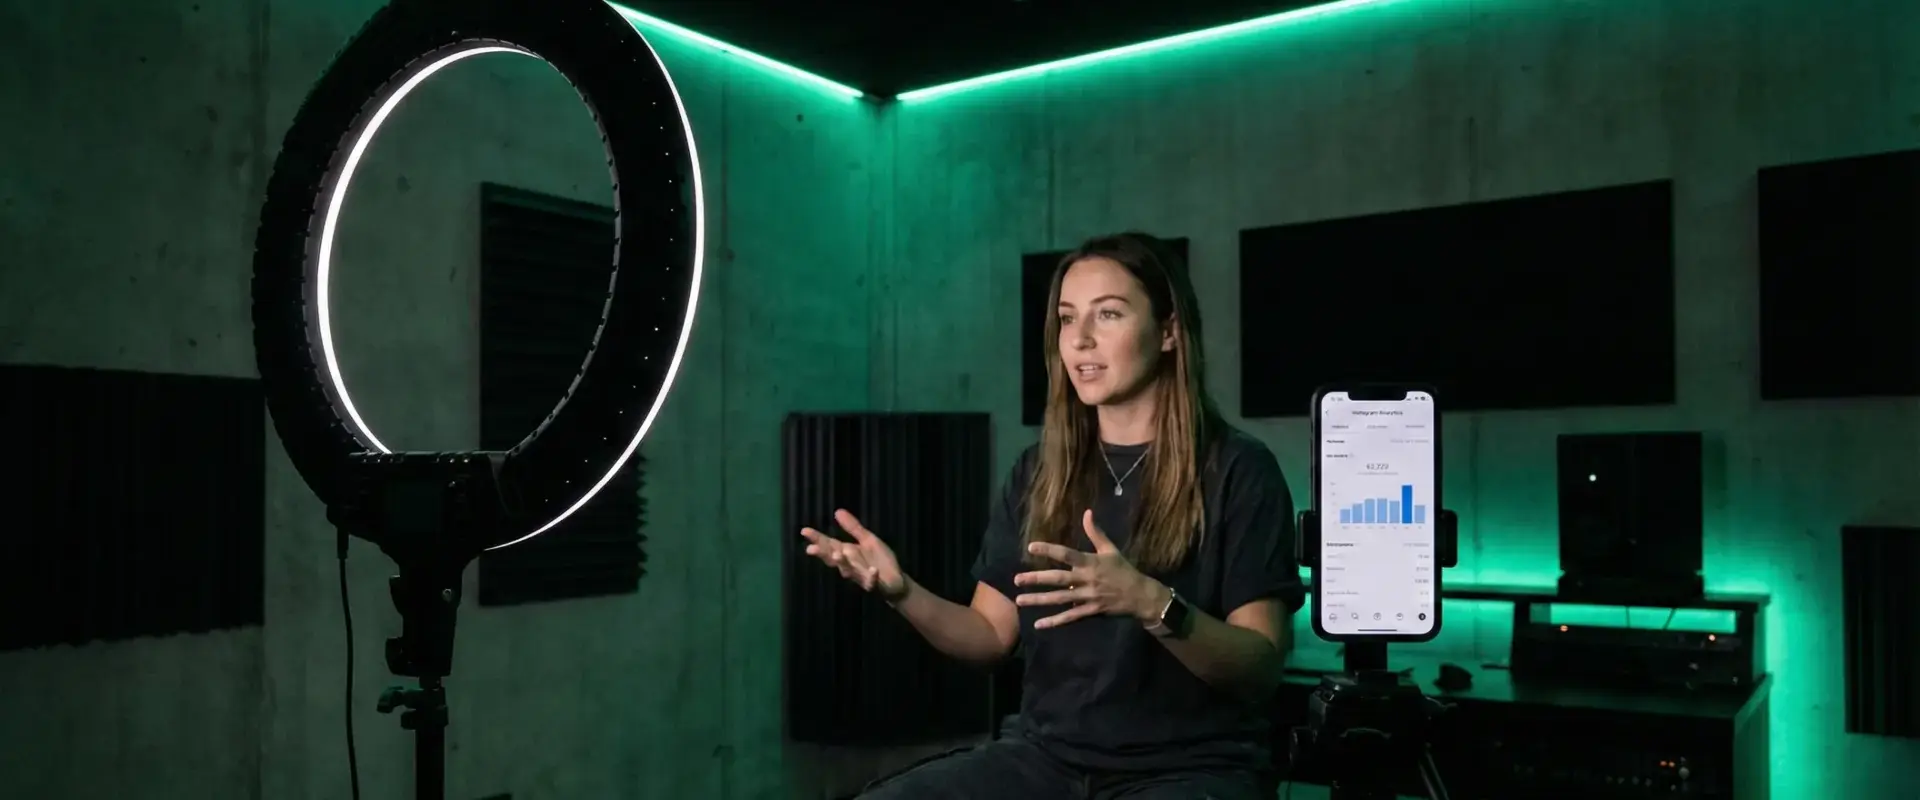
A good Instagram engagement rate in 2026 is around 4% or higher. The average sits at roughly 2% to 3%, so anything above that band is performing. Those figures come from Later’s 2026 Instagram engagement rate analysis, which puts the overall average at 2.88%, single images at 2.76% and non-Reels video at 2.60%.
The number on its own is not the useful part. What matters is which denominator was used, which tier the creator sits in, and whether the rate is being compared against the right benchmark. This guide covers all three.
The formula, and why it matters which one you use
There are two common calculations and they produce very different numbers.
| Method | Calculation | Use it when |
|---|---|---|
| Engagement rate by followers | Total engagements divided by follower count, times 100 | Comparing creators before you work with them |
| Engagement rate by reach | Total engagements divided by accounts reached, times 100 | Judging content performance once you have analytics access |
Engagement rate by reach is almost always the higher number, because reach is smaller than follower count on most posts. A creator quoting 8% by reach and a creator quoting 8% by followers are not comparable. Always ask which method produced the figure, and ask for screenshots rather than a claim.
The second variable is what counts as an engagement. Likes and comments is the traditional definition. Adding saves and shares raises the number, and on Instagram saves and shares are the signals that actually correlate with distribution. Neither is wrong. They just have to match on both sides of a comparison.
Benchmarks by tier
Engagement rate falls as follower count rises. A nano creator with a genuinely engaged community routinely beats a macro creator with ten times the reach. Later’s data puts nano creators under 10,000 followers at around 4%, against an all-creator average of 2.88%.
That inverse relationship is the entire commercial case for the small end of the market. The Influencer Marketing Hub benchmark report found nano creators at 51.43% expansion intent and micro at 52.83%, while macro creators were flat at 20.59% expansion against 20.58% contraction. Buyers are following the engagement, not the reach.
Benchmarks by platform
Rival IQ’s social media industry benchmark report found that engagement rates fell on every platform in its most recent study. Facebook dropped 36%, Instagram 16%, TikTok 34% and X 48%. TikTok still outperforms every other platform for engagement despite the decline.
Two things follow from that. First, a rate that looks weak against a two year old benchmark may be perfectly healthy against a current one, so check the date on any benchmark you are handed. Second, cross-platform comparison is close to meaningless. A 1.5% Instagram rate and a 1.5% TikTok rate are not the same result.
Benchmarks by industry
Sector matters as much as platform. Rival IQ’s data shows higher education consistently leading TikTok engagement, nonprofits performing above median across every channel, and sports teams earning close to five times the median Facebook engagement rate on photo posts. Influencer accounts themselves performed strongly on Facebook and Instagram but fell 36% below the median on TikTok.
Compare a creator against others in their own category on their own platform. A 1.2% rate in financial services may be excellent. The same rate in beauty is not.
When a high engagement rate is a warning sign
- Engagement pods. Reciprocal comment groups inflate comment counts with generic replies. Read the comments. If they are all emoji and “great post”, the number is decorative.
- Bought engagement. Purchased likes produce a rate that does not match the account’s story views or saves. Ask for the full insights panel, not one screenshot.
- Giveaway spikes. A competition post can carry an account’s average for months. Ask for a rate across the last ten posts, excluding giveaways.
- Tiny follower counts. A creator with 800 followers can hit 15% with forty likes from friends. That is real engagement and no commercial reach.
- Rate quoted without a method. If nobody will say whether it is by reach or by followers, assume the flattering one was chosen.
What to measure instead, or as well
Engagement rate is a screening tool, not an outcome. It is useful for deciding who to approach and what to pay. It is poor at predicting revenue.
Once a campaign is running, measure the things attached to money. The benchmark report found promo and discount codes were the most adopted measurement method at 45.9% of respondents, followed by affiliate links at 26.0% and native shop features at 25.0%. Those give you attributable revenue rather than an interaction count.
Saves and shares deserve separate attention on Instagram. A post with a modest like count and a high save count is doing more for you than the reverse, because saves signal intent rather than approval.
How to use engagement rate in a negotiation
Ask for the rate across the last ten non-giveaway posts, calculated by reach, with a screenshot of the insights panel. Compare it against a current benchmark for that platform and that sector. Then price against the gap.
A creator materially above their category benchmark can justify a premium. A creator at or below it should be priced at or below the tier band. This is the single most useful thing an agency does on rate negotiation, because it replaces a follower count anchor with a performance anchor. Terrier’s approach to tier selection is set out on the micro-influencer marketing page, and ongoing roster work on the creator management page.
Setting your own target
For your brand’s own accounts, stop comparing against a global average and start comparing against your own last twelve months. The useful question is whether the percentage of your audience that engages is holding as the audience grows. An account that doubles its followers while halving its engagement rate has not grown. It has diluted.
Set a floor rather than a target. Decide the rate below which a content format gets retired, review monthly, and let the format mix change. That is a decision rule you can actually act on, unlike a number on a dashboard.
Format changes the number as much as tier does
Later’s data shows single images averaging 2.76% and non-Reels video averaging 2.60%, against an overall 2.88%. Rival IQ’s sector data points the same way, with photo posts leading Facebook engagement for several industries and Reels and carousels leading Instagram engagement for fashion brands.
The practical consequence is that a creator’s headline rate is partly a description of what they post rather than how good they are. A creator whose feed is mostly carousels will look stronger than one posting mostly single images, in a category where carousels perform. Compare like with like, or ask for the rate broken down by format.
It also means you can improve your own rate by changing the mix rather than the audience. That is the cheapest lever available and the one most brands ignore while chasing follower growth.
A ten minute creator vetting process
- Ask for insights screenshots covering the last thirty days, not a single post.
- Calculate engagement rate by reach across the last ten non-giveaway posts.
- Read twenty comments. Look for real sentences rather than emoji strings.
- Check the follower growth curve for sudden vertical steps, which suggest bought followers.
- Check the audience location split against your market. Reach in the wrong country is not reach.
- Compare the result against a current benchmark for that platform and sector.
Six checks, ten minutes, and it eliminates most of the accounts that would have wasted a campaign budget. It is also the evidence base for the rate conversation, because a creator materially above their category benchmark has a real argument for a premium and a creator below it does not.
Frequently asked questions
What is a good engagement rate on Instagram?
Around 4% or above is good. The average in 2026 is roughly 2% to 3%, with an overall figure of 2.88%.
Is engagement rate by reach or by followers better?
By reach is more accurate for judging content. By followers is more practical for screening creators before you have analytics access.
Why is my engagement rate falling?
It may not be you. Rival IQ recorded declines on every major platform, including Instagram at 16% and TikTok at 34%.
Do smaller creators really engage better?
Yes. Nano creators under 10,000 followers average around 4%, well above the all-creator average.
Should engagement rate decide who I book?
It should shape the shortlist and the price. Booking decisions should also weigh audience fit, content quality and whether the creator’s followers are in your market.
Related pages
- Influencer marketing pricing and packages
- Micro-influencer marketing
- Creator management and brand ambassadors
- Schedule a call to benchmark a creator shortlist before you book.
Ready to grow your brand?
Take the first step towards improving your digital presence.
Get a Free AuditLatest SEO Articles

AI Visibility: Does ChatGPT Recommend Your Brand?
To find out whether ChatGPT recommends your brand, ask it the questions your buyers ask, run each one several times in a fresh session, and…

SEO Audit Checklist: 40 Checks to Run in 2026
An SEO audit checks four things in order: whether Google can crawl the site, whether it indexes the right pages, whether those pages answer the…
Influencer Rate Card UK 2026: What Creators Charge
A UK creator rate card in 2026 is built per format, not per platform, and it prices four things separately: the post, the usage rights,…
Terrier runs influencer campaigns for 320+ brands, from £1,100 a month.
Schedule a call